Gap Analysis compares your current security tools against 9 frameworks, ranks every uncovered control by real business risk, and recommends specific tools to close the gaps — with rationale, cost context, and six executive-ready PDF reports.
What It Does
Traditional assessments hand you a spreadsheet of uncovered controls. You spend weeks stitching together tool research, vendor conversations, and budget justifications before any real work begins.
Gap Analysis collapses that into a single view. Point it at your current tool inventory, pick a framework, and walk away with a ranked list of every gap, the best tools to close each one, cross-coverage intelligence, and a board-ready PDF you can hand to leadership the same day.
The Workflow
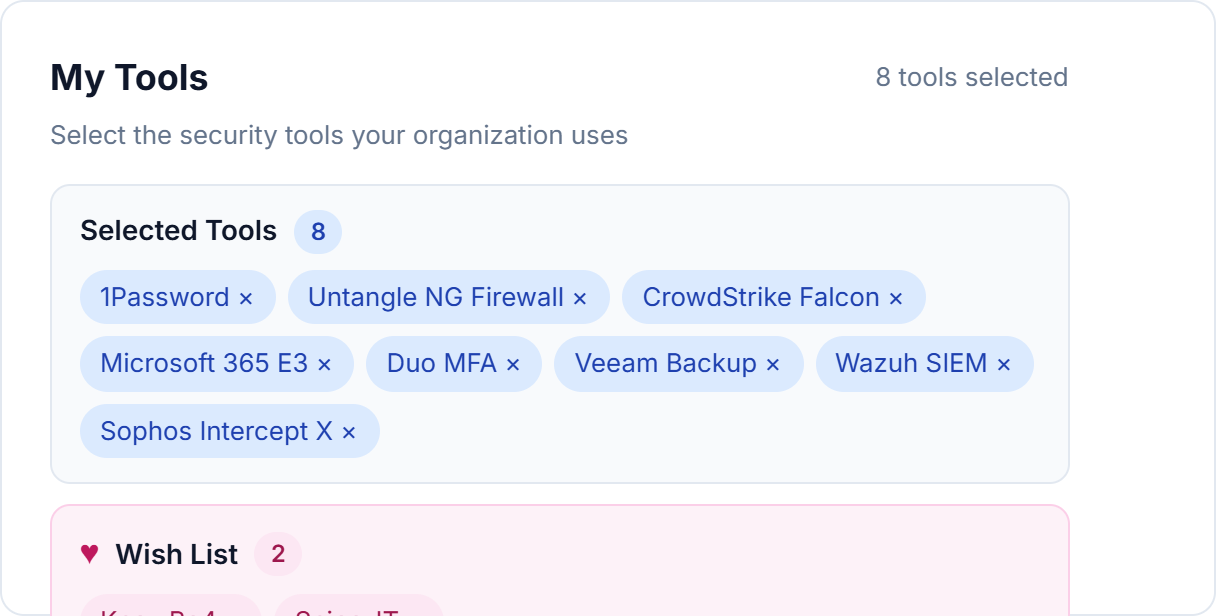
Select the tools you currently deploy from a searchable catalog of 450+ security products. Add a Wish List of tools you're considering — Gap Analysis can model coverage with and without them.
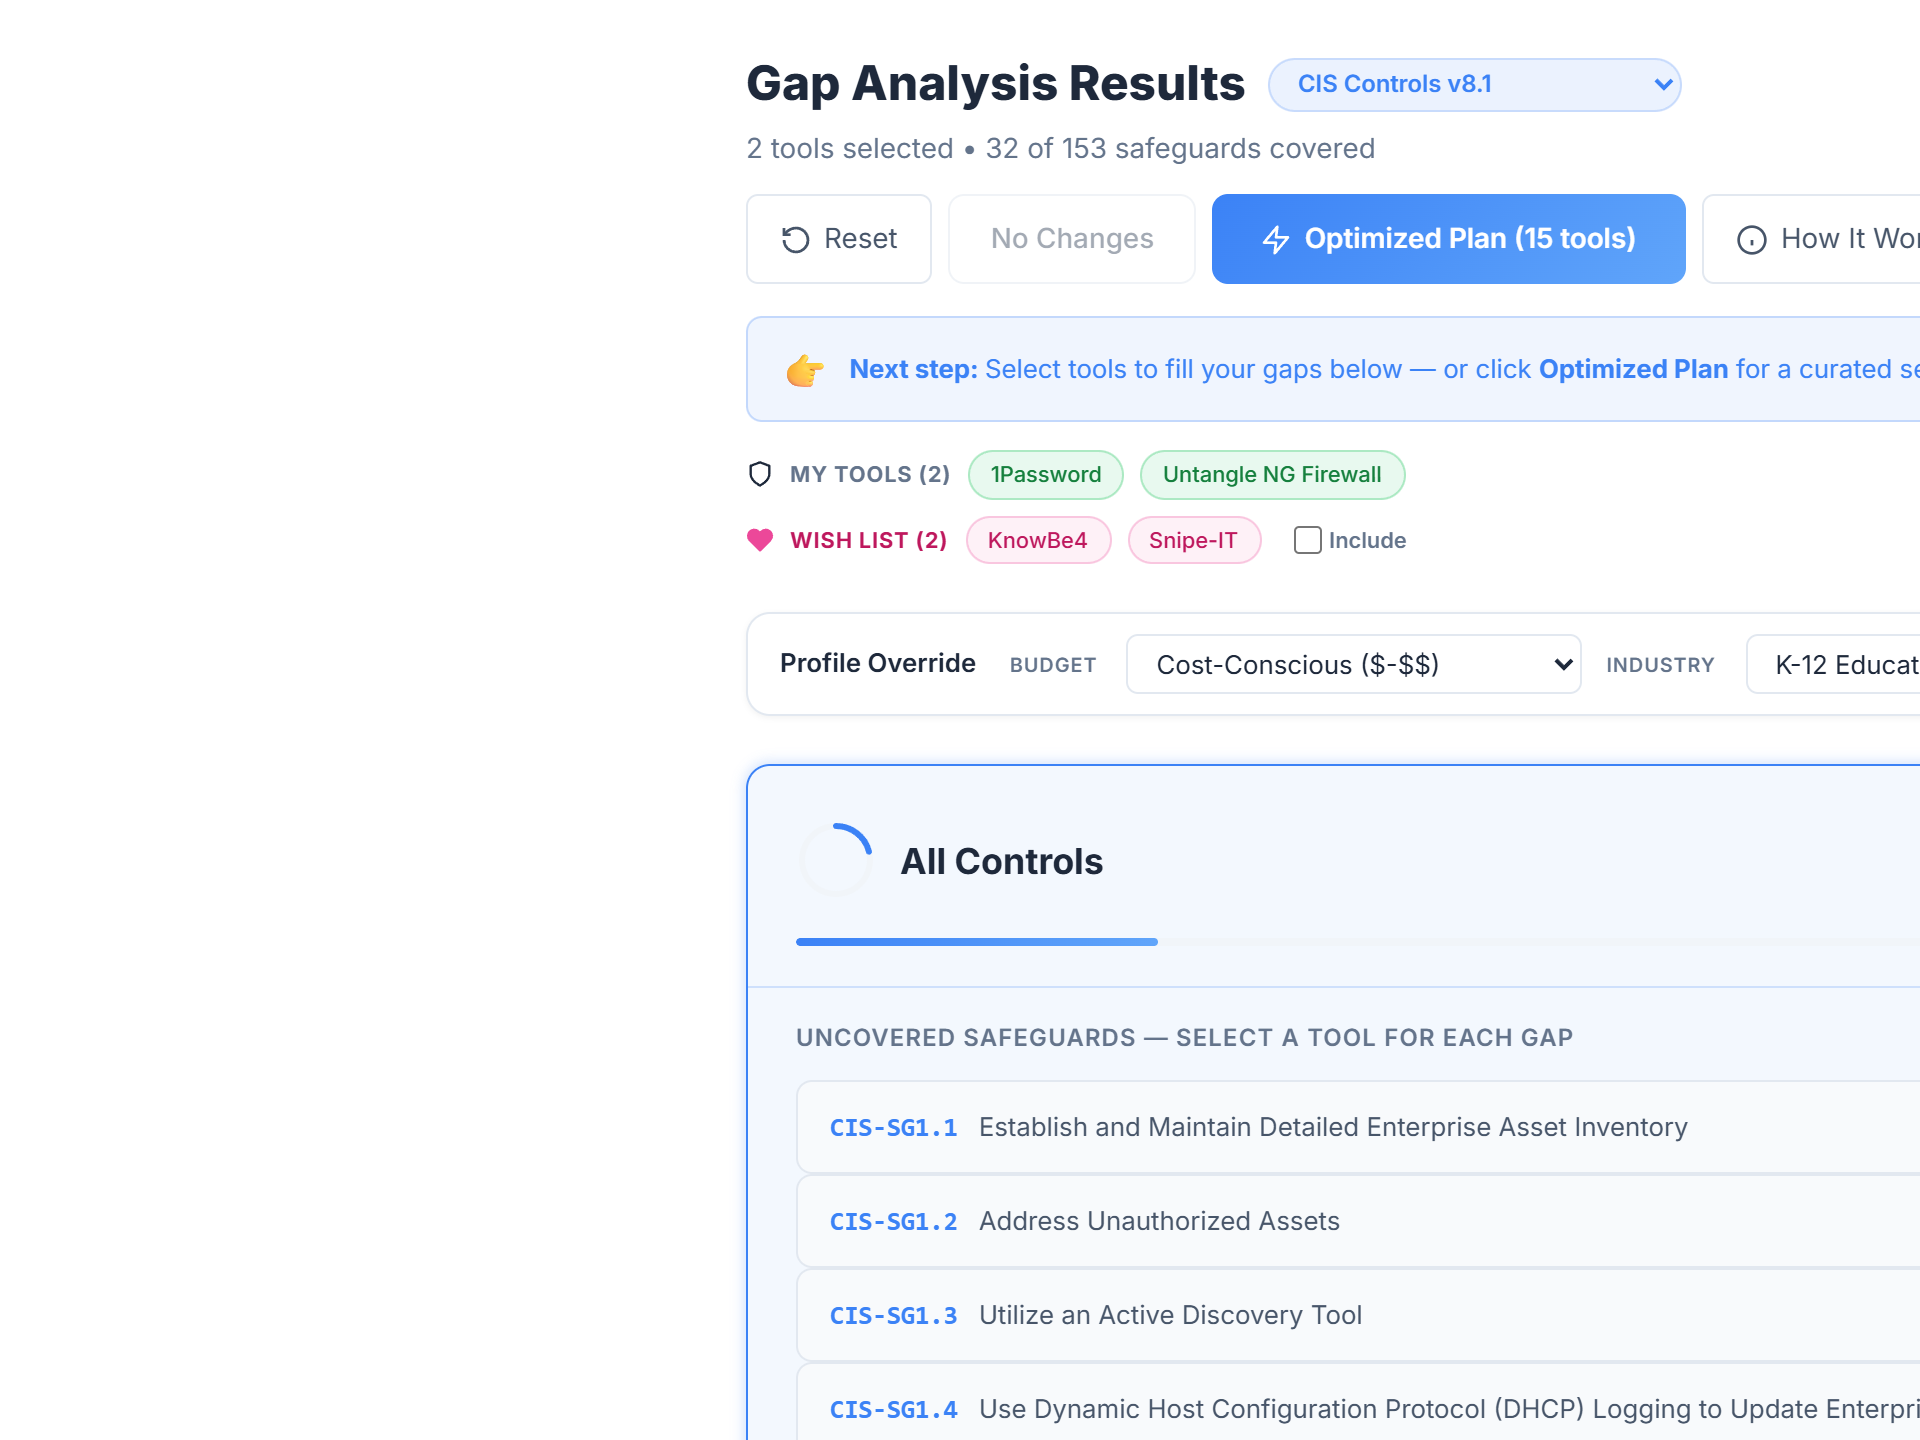
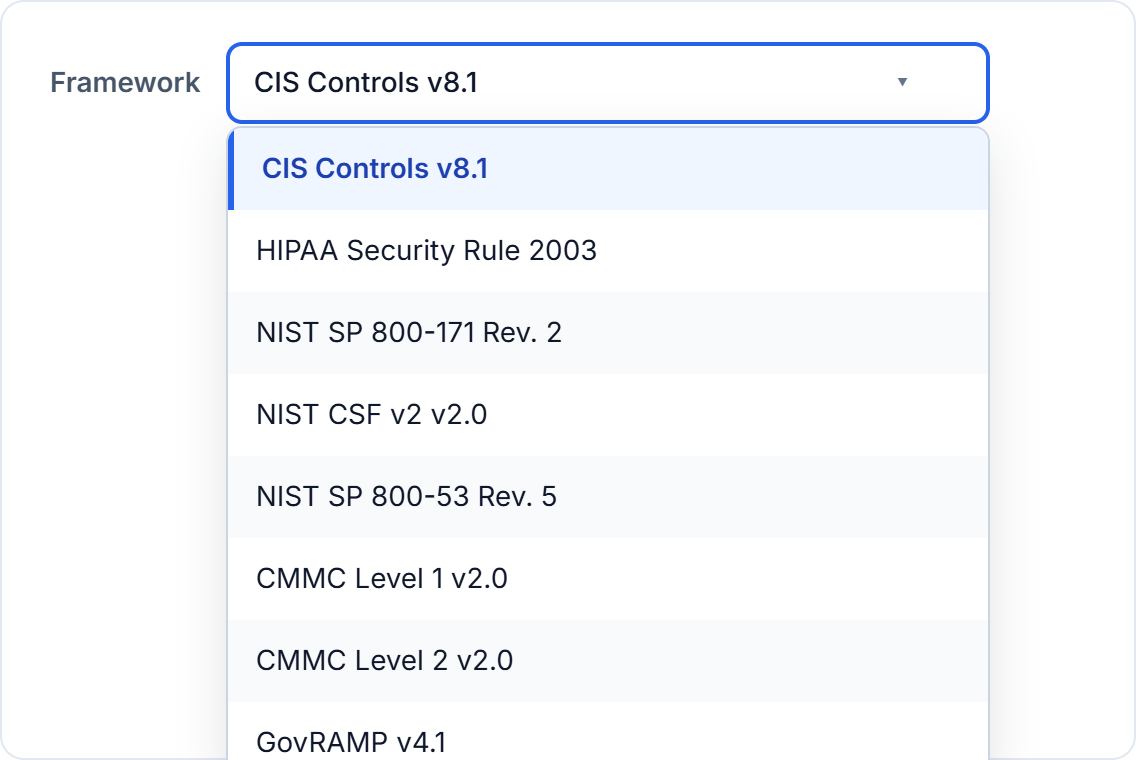
Switch between CIS Controls v8.1, NIST CSF v2.0, NIST 800-53, NIST 800-171, CMMC Level 1, CMMC Level 2, HIPAA Security Rule, GovRAMP, and the Texas Cybersecurity Framework with a single dropdown. Your tool coverage is recalculated live for whichever framework you choose.
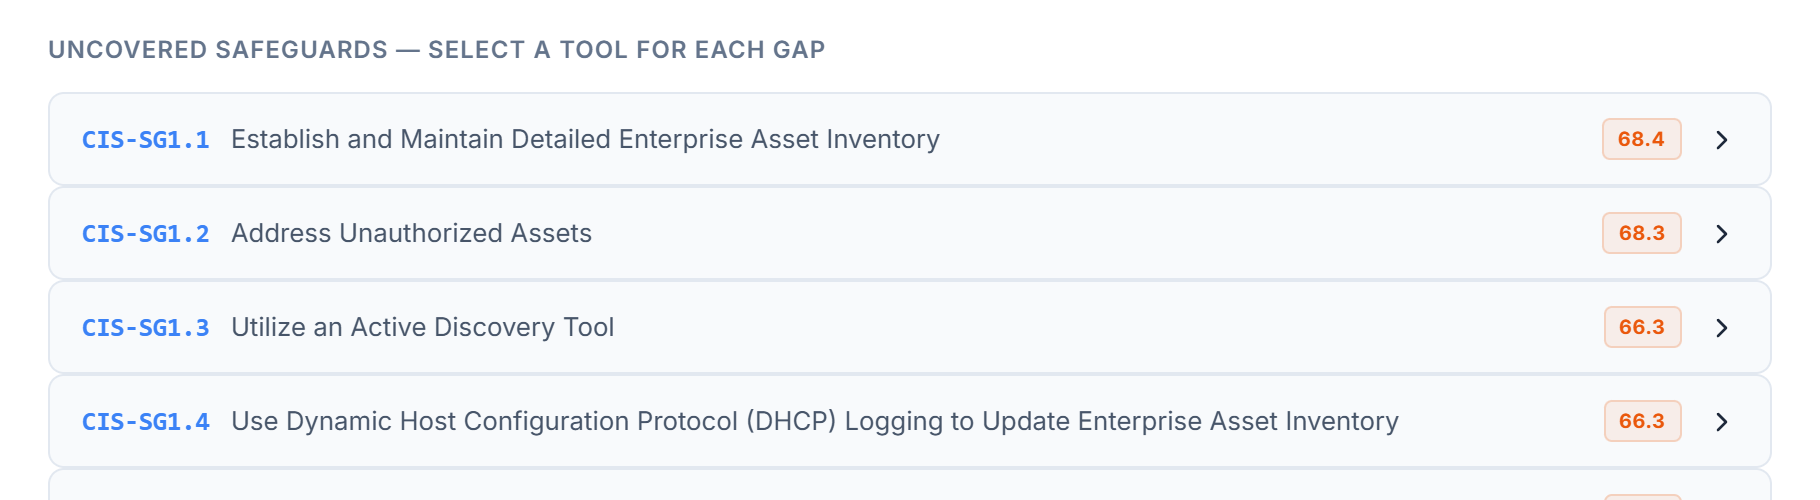
Tier cards show how close you are to each level of maturity — which safeguards are already covered, which have gaps, and how many gaps remain in each tier. Covered tiers collapse; active tiers stay expanded with a list of uncovered safeguards.
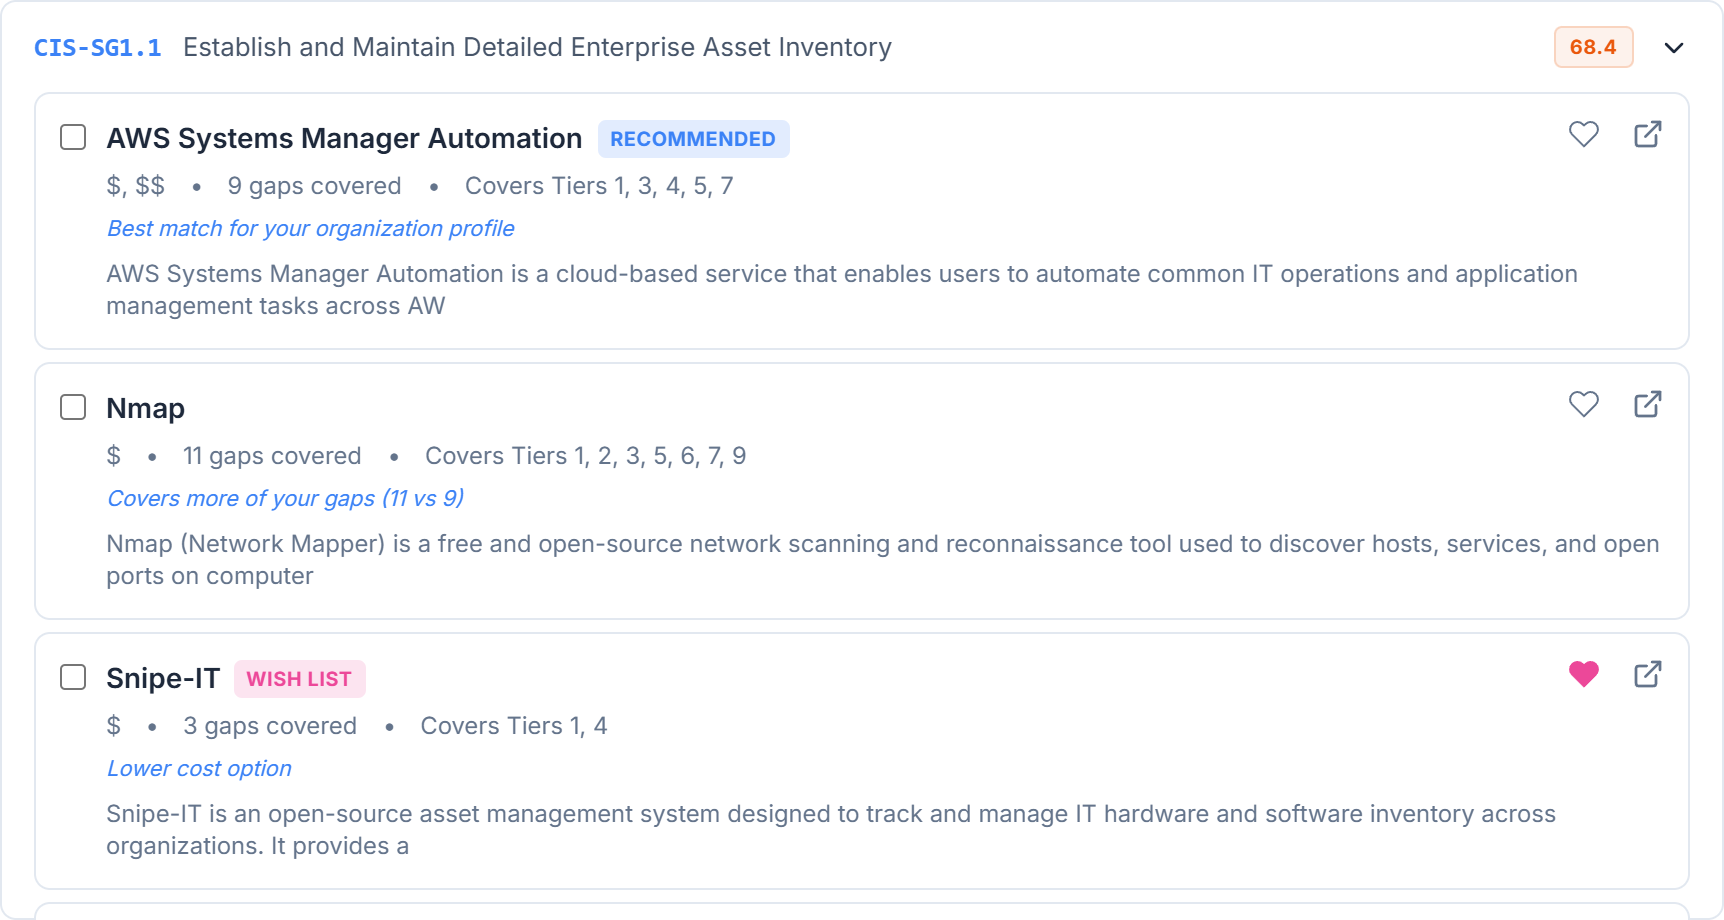
Every safeguard gets a priority score from the UCPA engine (next section).
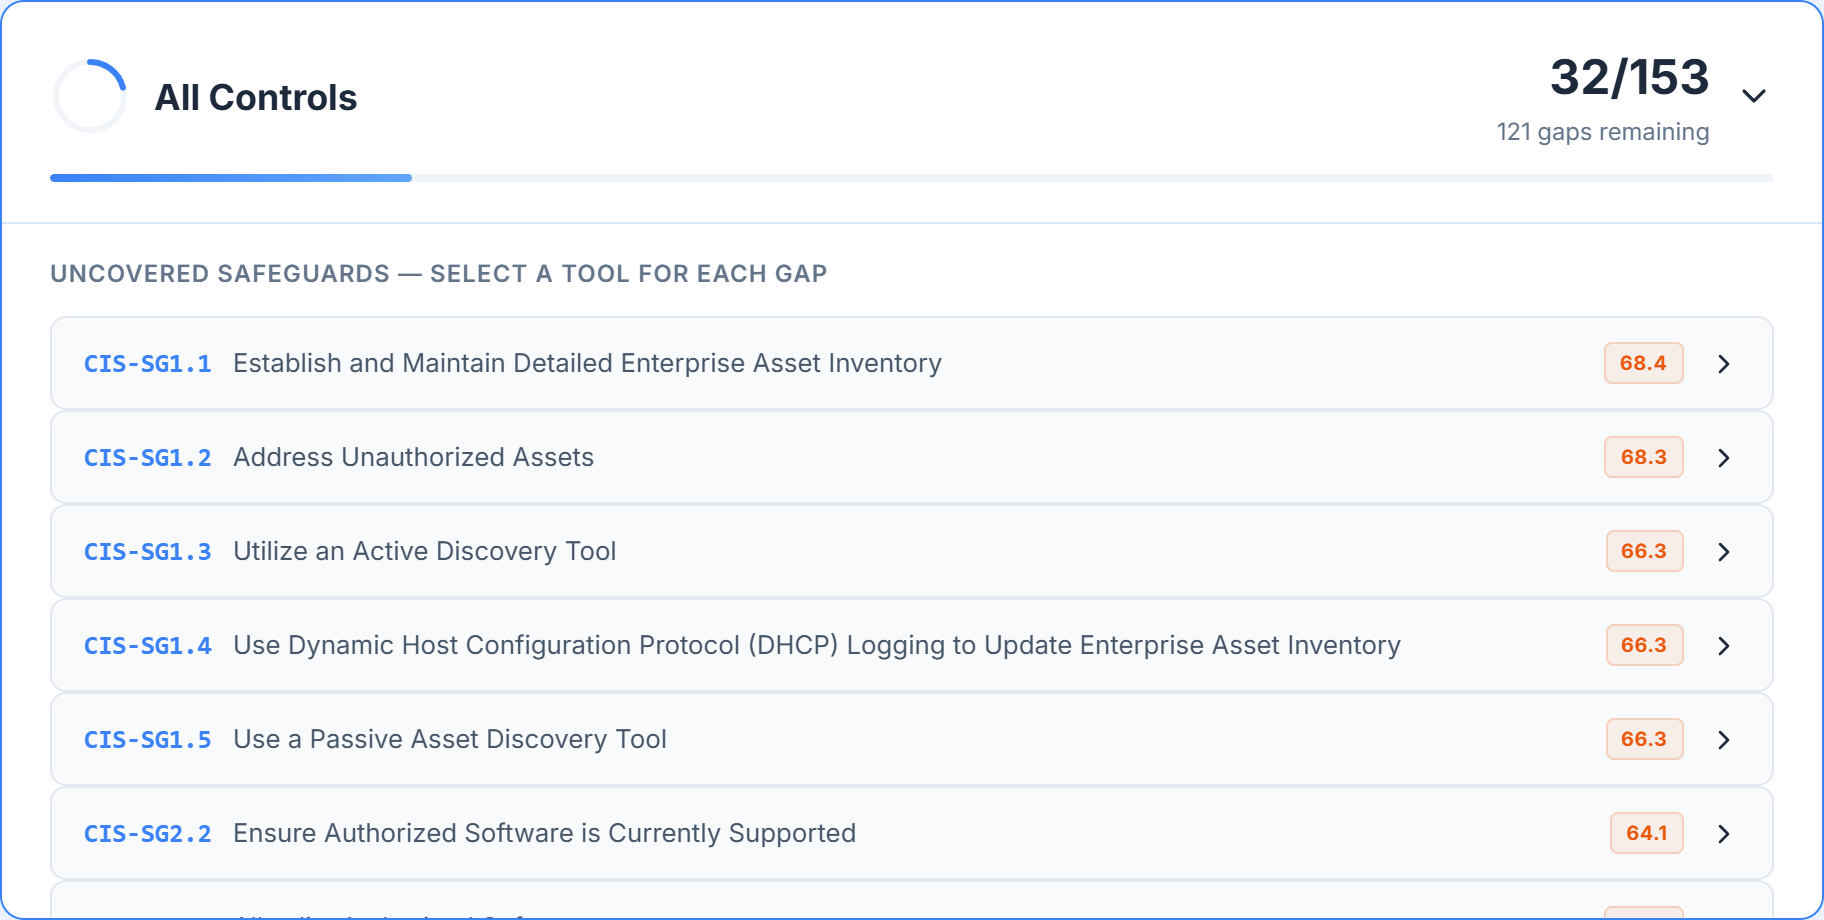
Expand any gap to see the top-ranked tool plus up to 7 alternatives, each with its own rationale: "Best match for your organization profile," "Covers 11 vs 9 of your gaps," "Lower cost option," or "Available through your partner."
Need to see beyond the top 8? A "Show more tools" expander surfaces every remaining tool mapped to that control.
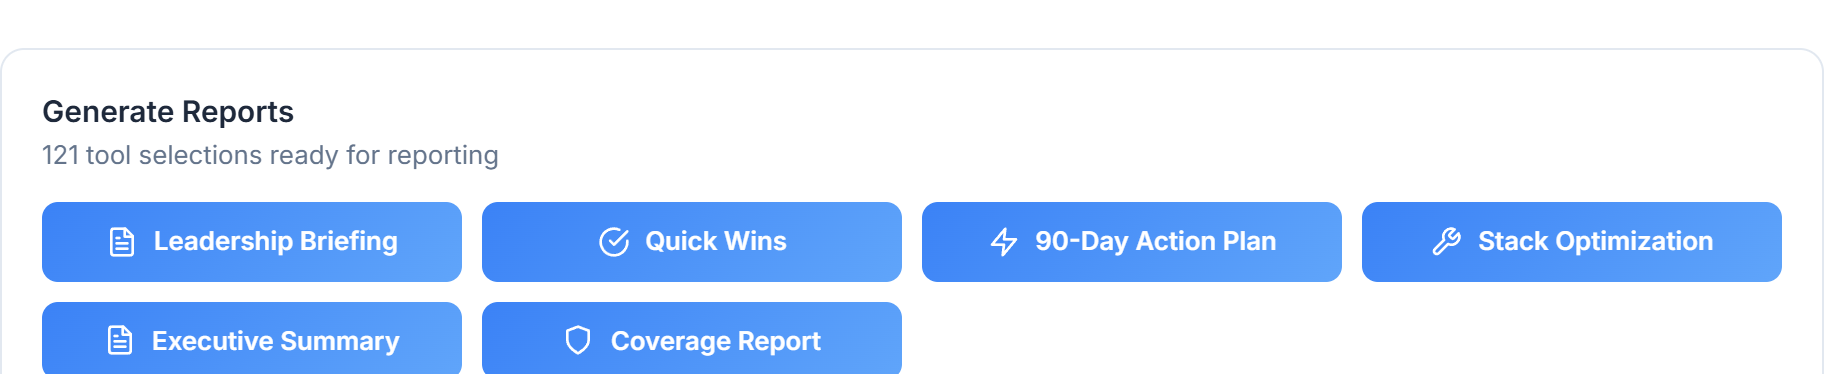
Select the tools that make sense for your budget and unlock six dedicated PDF reports — from a one-page Leadership Briefing to a 90-Day Action Plan to a full safeguard-by-safeguard Coverage Report.
Each report is branded, paginated, and ready for board packets.
How Coverage Is Measured
When we say a tool "covers" a safeguard, we don't treat every mapping the same. Tools map to safeguards with one of three strengths — and your coverage percentage reflects that strength, not a binary tick.
The tool is the primary control for this safeguard. Selecting it solves the problem.
The tool helps with this safeguard but isn't the primary control. A complementary control is often needed.
The tool touches the safeguard's domain loosely. A dedicated control is almost certainly required.
For each safeguard, we use the strongest mapping any of your selected tools provides. Coverage % is the weighted sum of those best-of mappings divided by the total safeguards in the framework. A binary "covered count" is also surfaced alongside for full transparency.
A mapping is not an implementation.
Mapping coverage shows that a tool has the capability to address a safeguard. It does not prove the tool is configured, deployed, monitored, or operating effectively in your environment. Treat coverage % as a planning signal, not a control-implementation attestation.
The Scoring Engine
Most compliance tools sort gaps alphabetically or by framework section. FrameworkMapper uses the Universal Control Prioritization Algorithm (UCPA) to rank every gap by business risk — so the controls that matter most to your environment surface first.
Each factor is weighted by your Security Profile (industry, org size, cloud footprint, data sensitivity). Change any input and every priority score recalculates live.
What Makes It Different
Every recommendation comes with rationale, cost context, coverage math, and the option to pick multiple tools per control.
The #1 recommendation is labeled with why — org-profile fit, cost alignment, analyst coverage, or vertical specialization.
Alternatives explicitly call out tradeoffs: "Covers 11 of your gaps vs 9" or "Lower cost option." No more guessing which is "better."
If your consultant has a partner catalog, their tools surface with a "Partner" badge and extra preference weight.
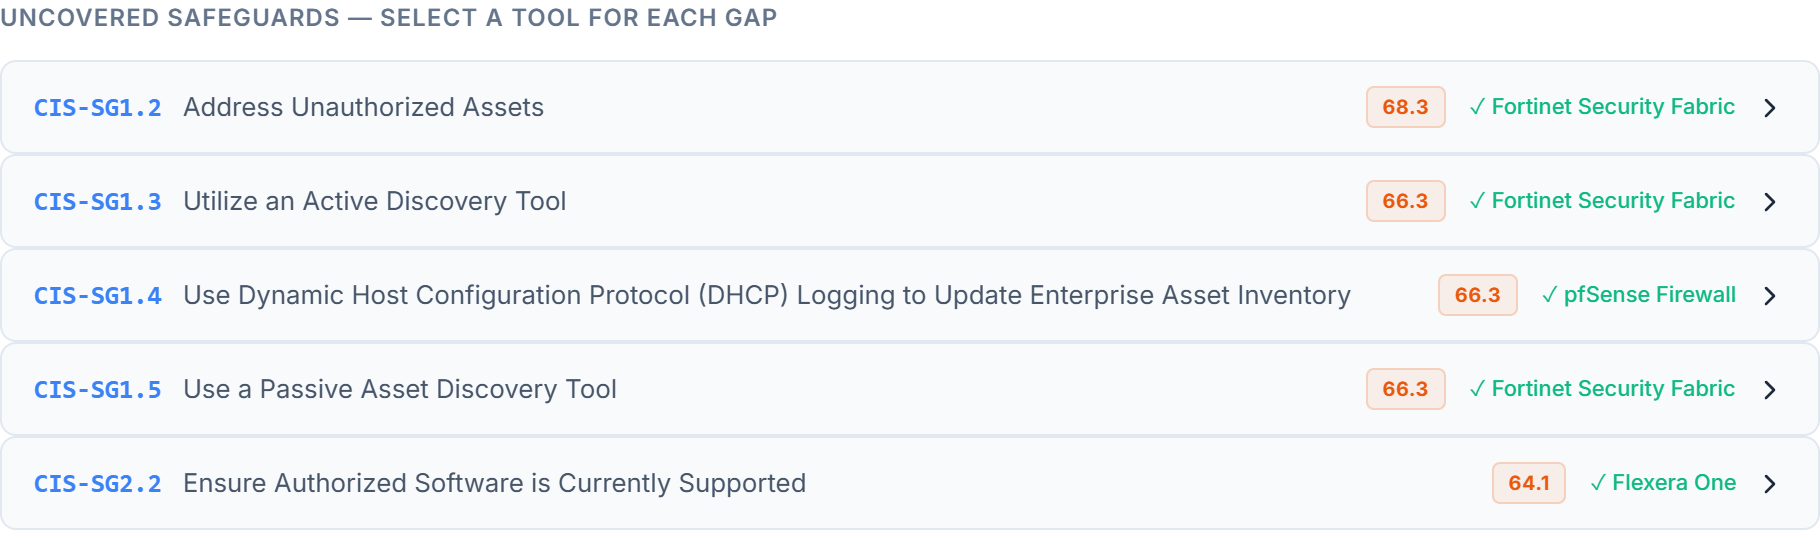
Real stacks don't map one-tool-per-control. Pick 2, 3, or more tools per gap — the header shows "✓ 3 tools" and every checkbox renders correctly.
Pick one tool and watch it auto-fill every other gap it covers. The UI shows "↳ Covered by <tool>" so you never double-buy for the same coverage.
One click surfaces the minimum set of tools needed to cover the maximum number of gaps — a lightning-bolt badge marks each pick.
Before & After
A live Posture Comparison panel shows your current coverage percentage next to the projected coverage if you were to acquire your selected tools — across the whole framework and per tier.
Enable the Wish List overlay to see the same comparison with tools you're still evaluating. Add or remove one tool and the numbers update instantly — no re-running the analysis.

Deliverables
Every report is generated as a branded, paginated PDF. No screenshot-style HTML prints — these are real typeset documents ready for board packets, procurement memos, and client deliverables.
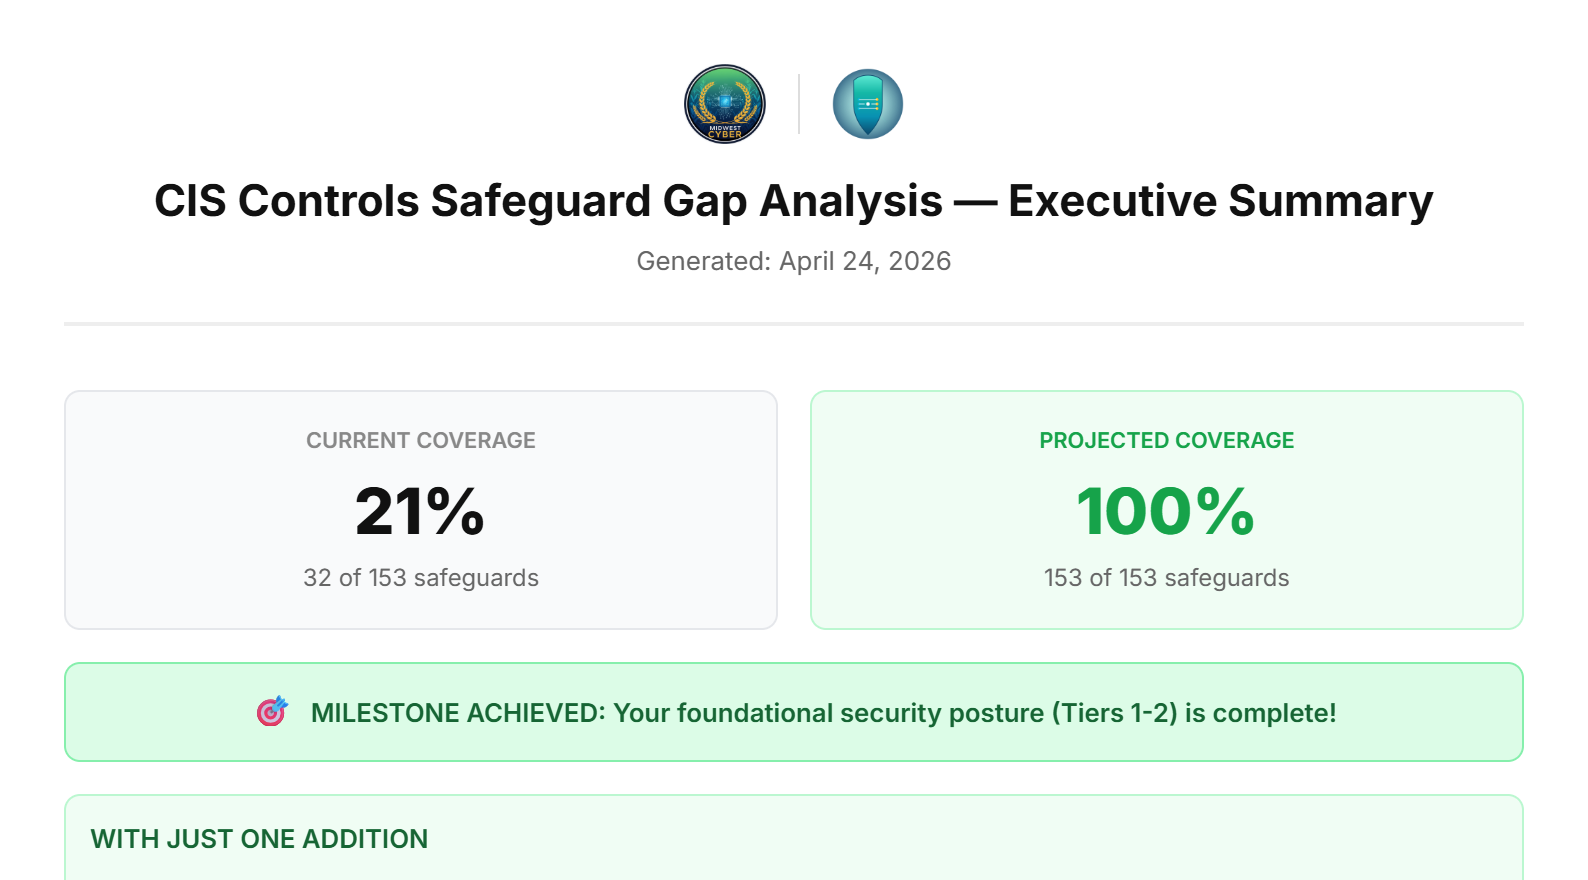
Coverage breakdown, recommended tools, projected posture. The default "show this to leadership" report.
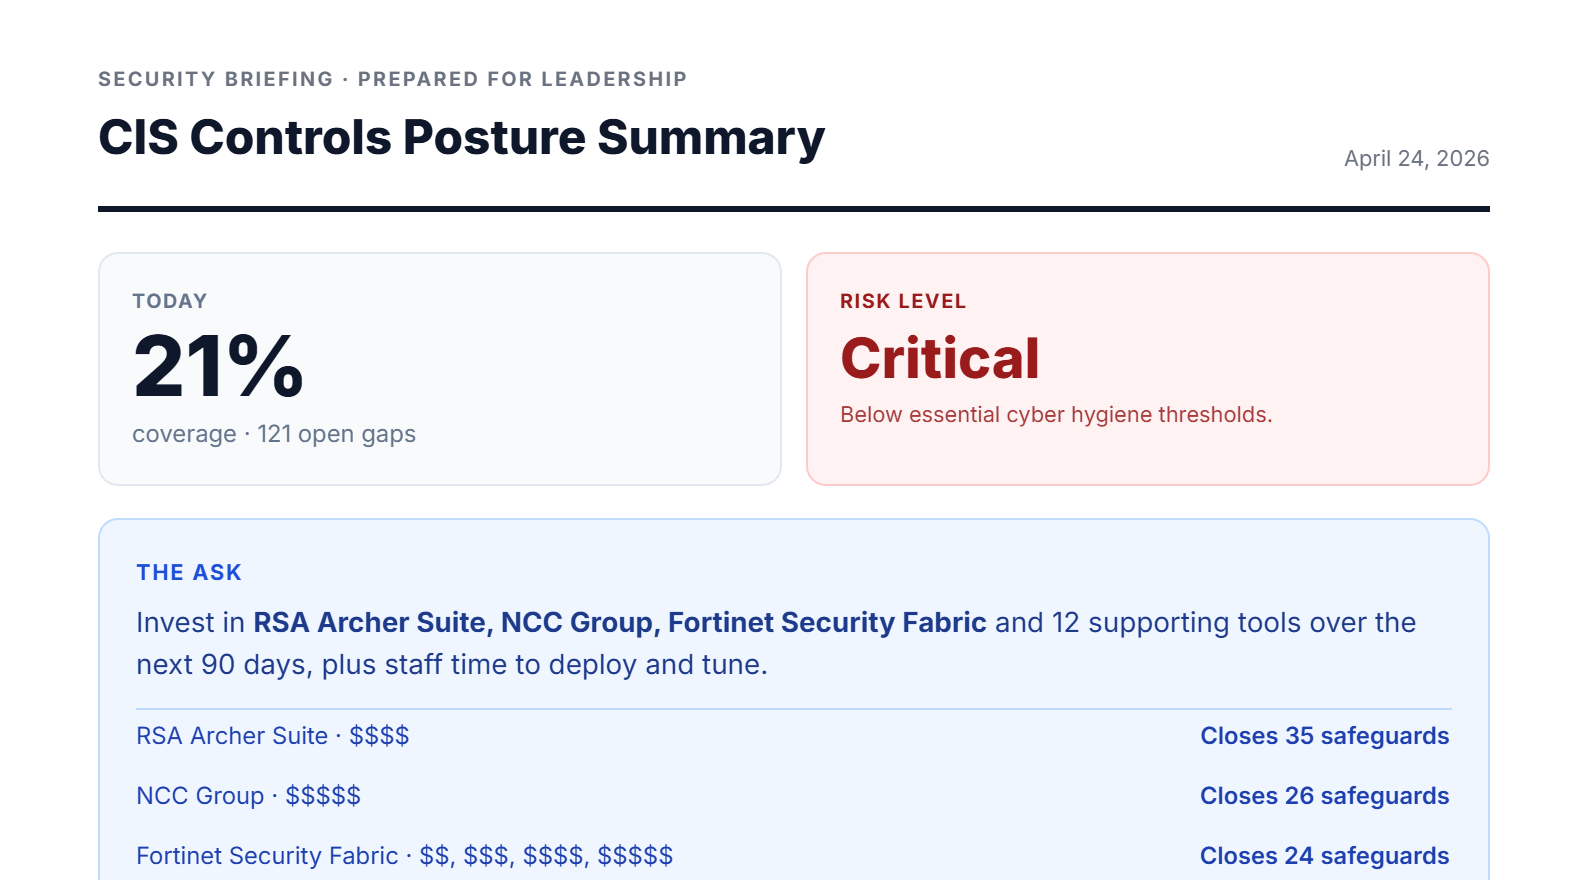
One page. Risk posture, the ask, what we get, what happens if we don't act, 90-day timeline.
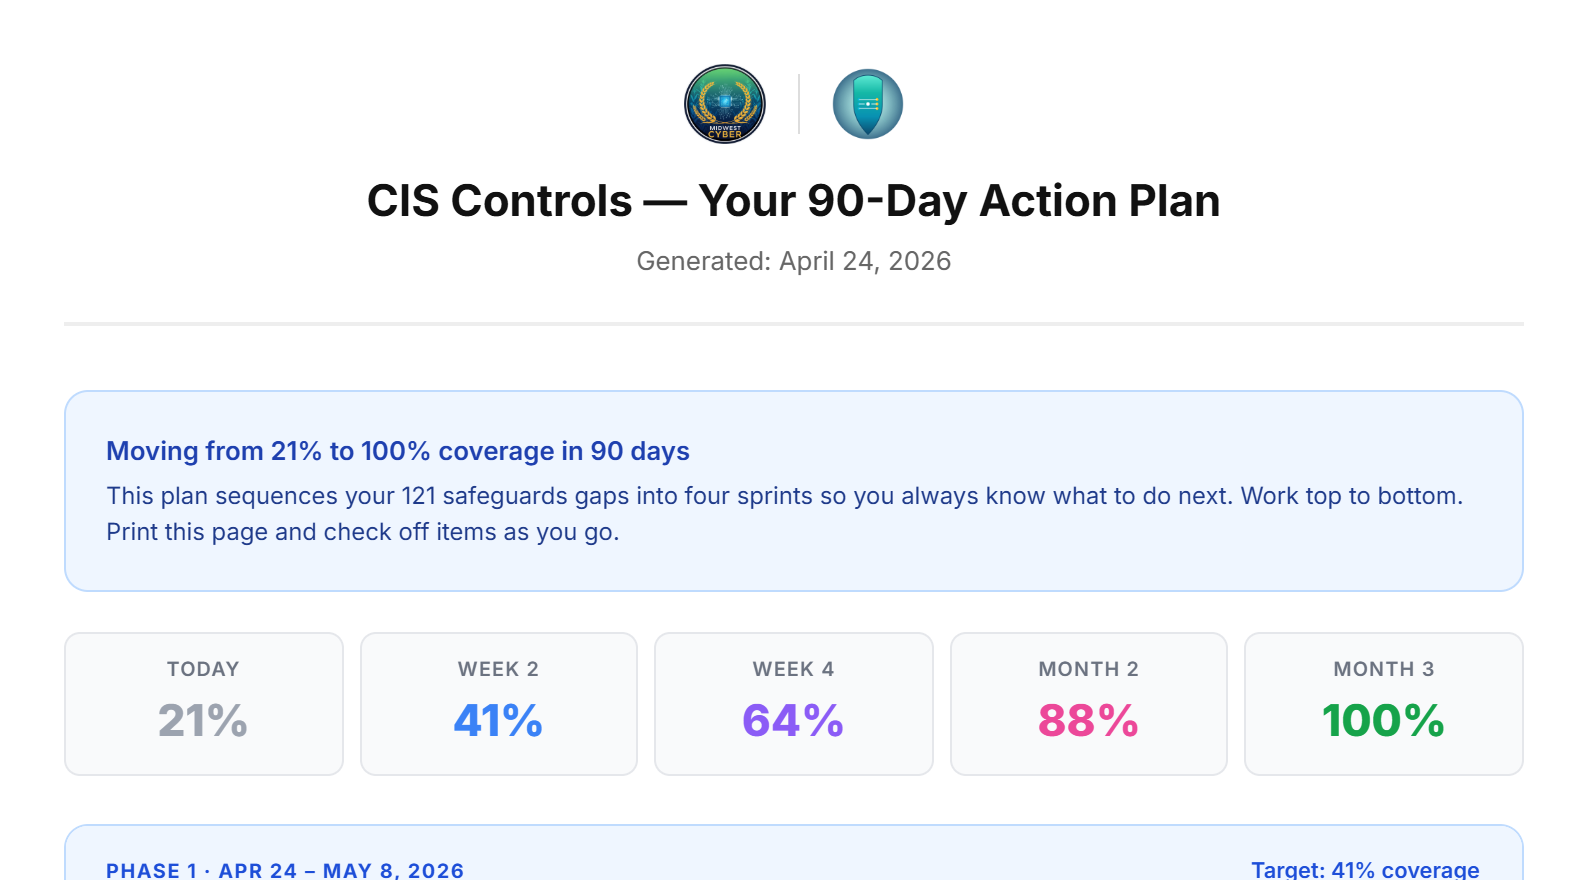
Four phases anchored to today's date, with a checklist per phase and per-item gap IDs.
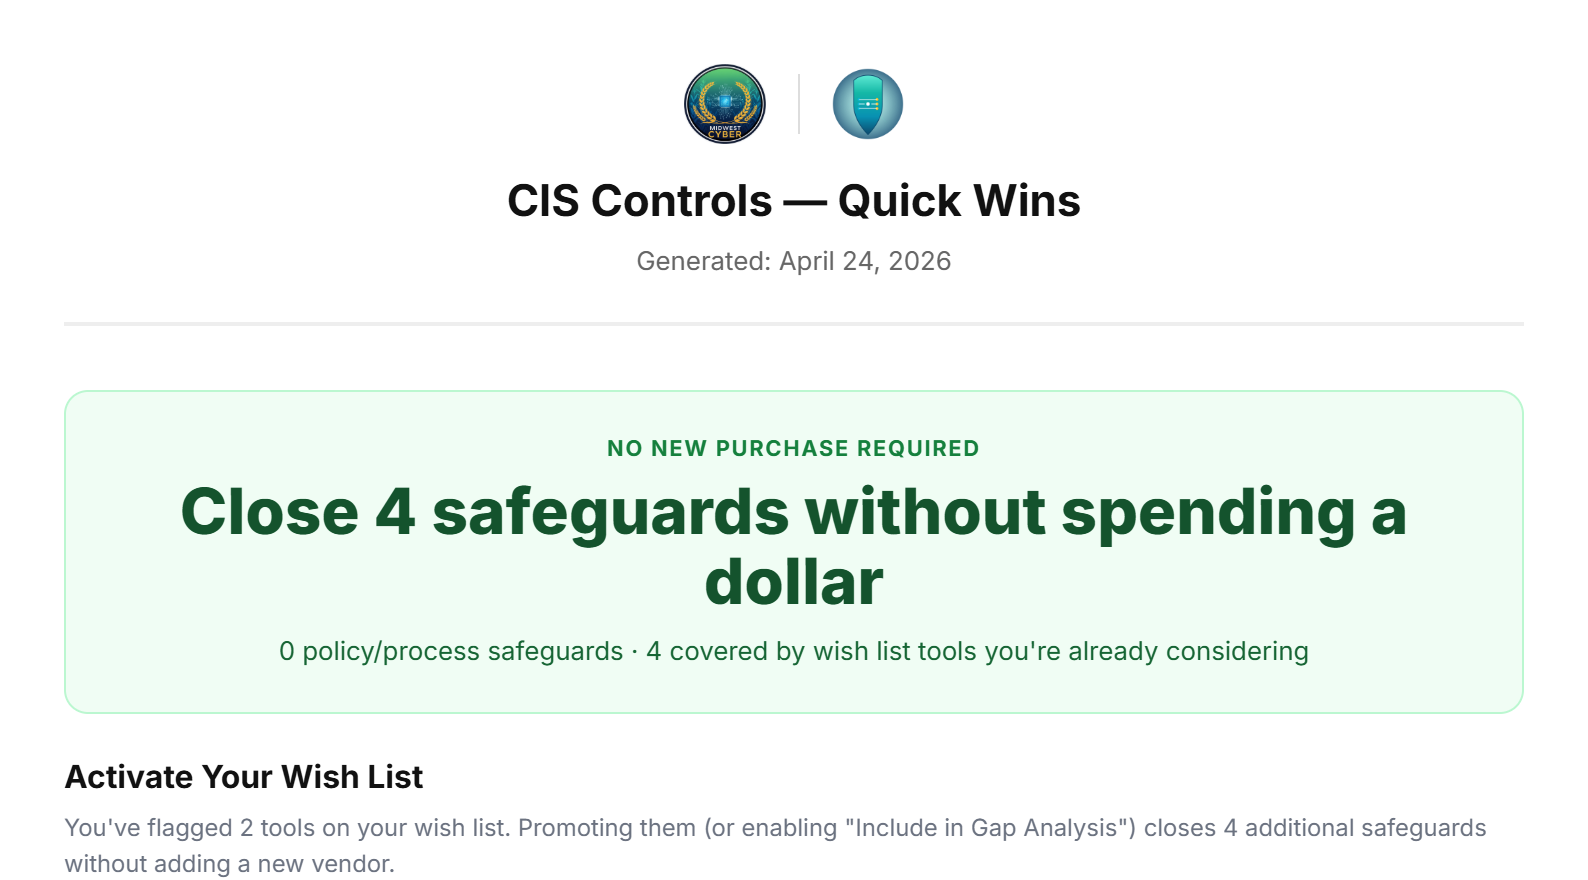
Every gap you can close for zero dollars — policy, process, and existing-tool activation wins.
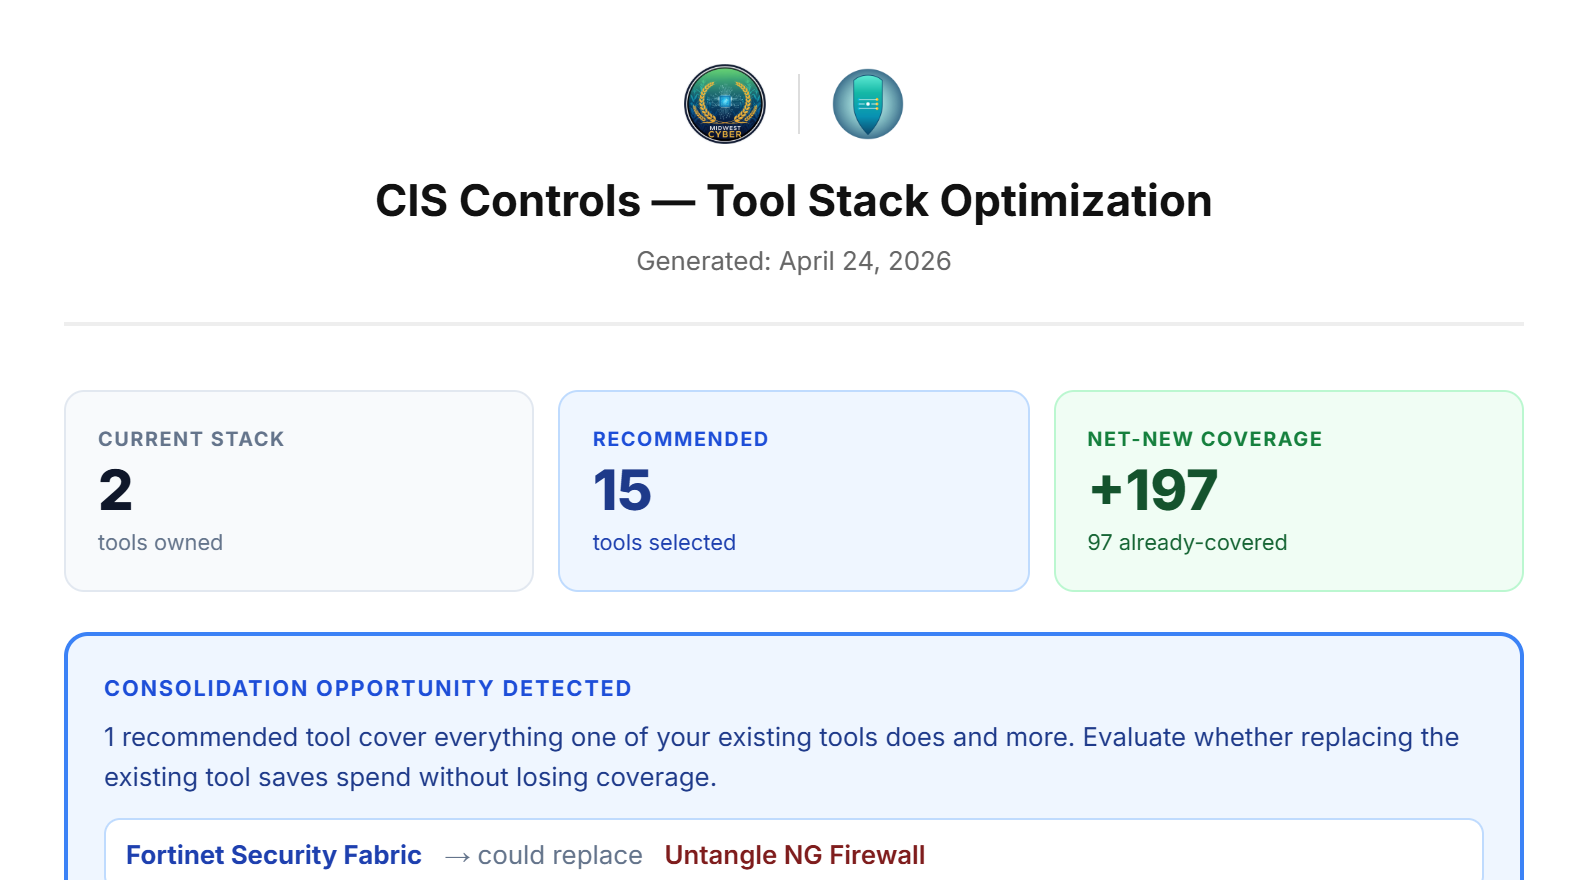
Current vs recommended stack, consolidation opportunities, overlapping-tool call-outs.
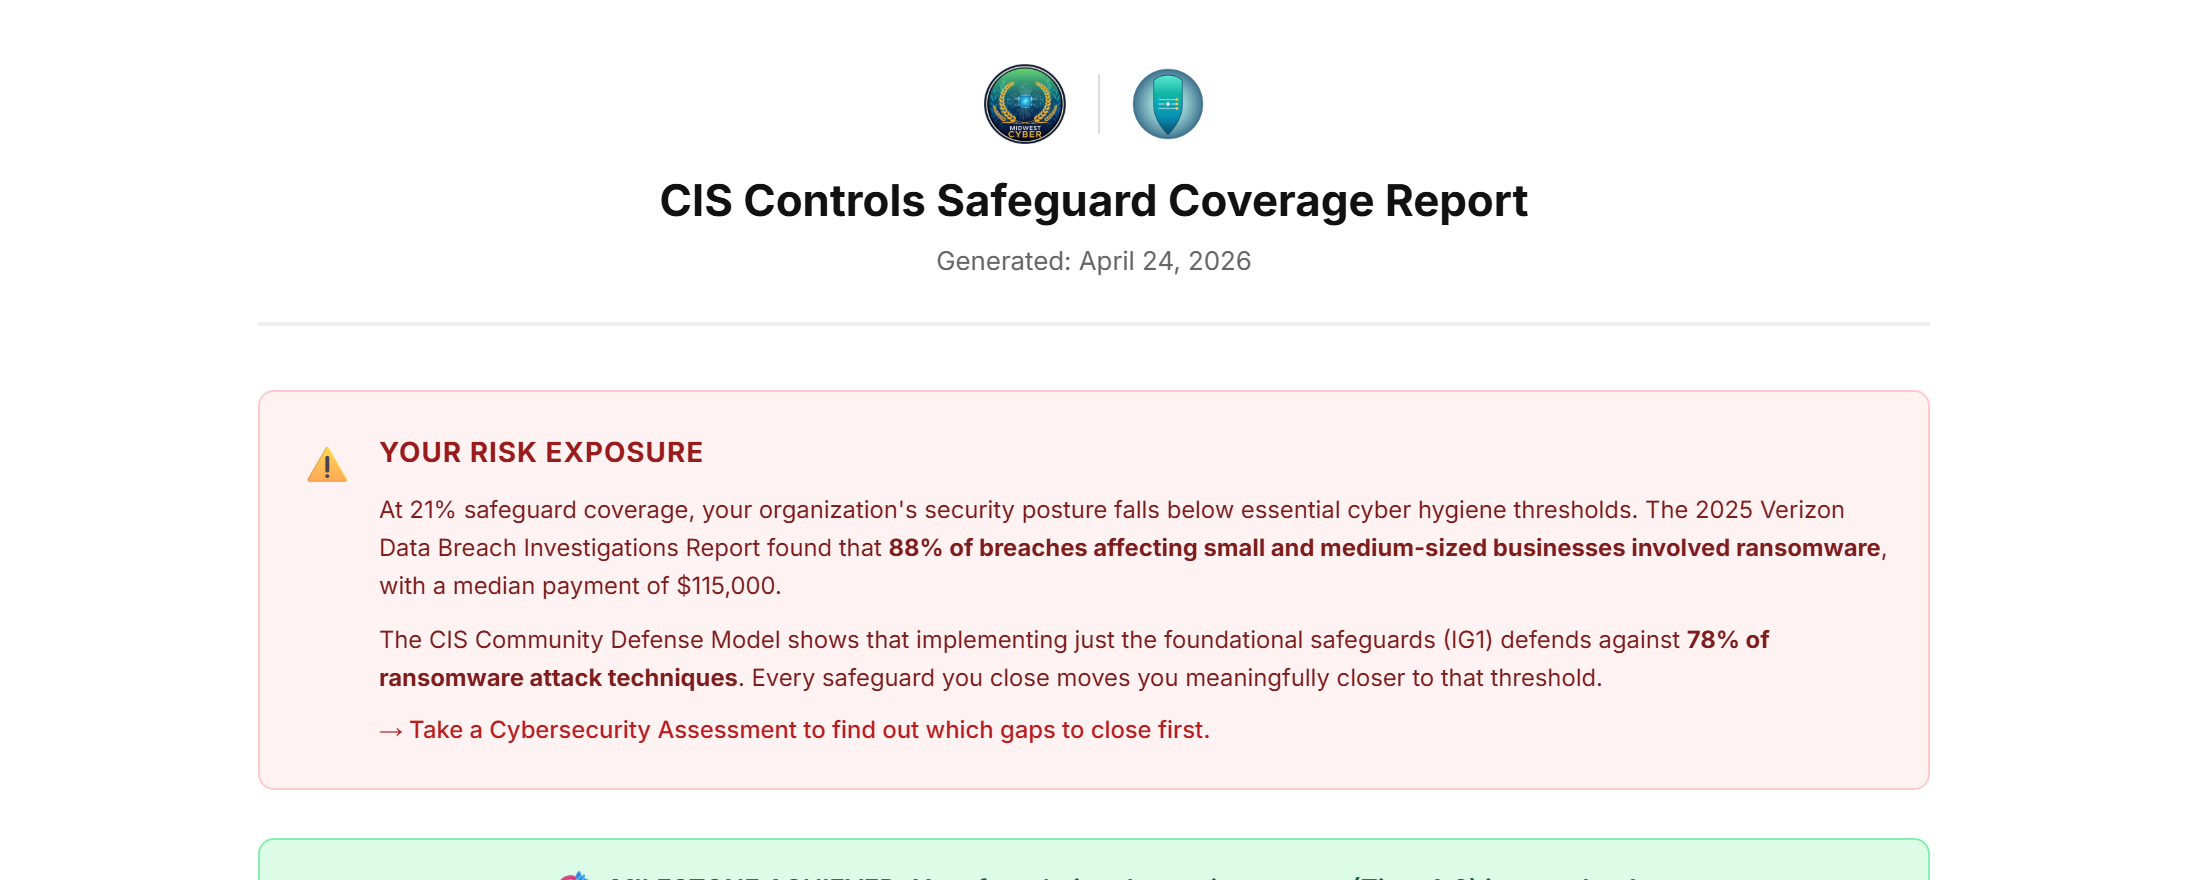
Full safeguard-by-safeguard table with color-coded status (Covered / Projected / Gap). Landscape.
Reports are generated client-side with jsPDF — your assessment data never touches our servers unless you explicitly save it.
One Tool, Seven Frameworks
Run the same assessment against whichever framework your auditor, insurer, or contract requires. Switch between them instantly and watch coverage recalculate.
Who It's For
Stop guessing what to buy next. See exactly which tools close which gaps, hand your CISO a Leadership Briefing, and use the 90-Day Action Plan as your procurement roadmap.
For ClientsWalk into every client debrief with ranked recommendations, branded PDFs, and a 90-Day Action Plan that closes the loop between assessment and engagement. Partner catalog integration surfaces your preferred tools first.
For PartnersStart with an assessment and have your first gap analysis in front of leadership by the end of the week.
Questions? Email sales@frameworkmapper.com.